FBF: That Time Uncle Claude Saved my Bacon
In my Flashback Friday series I’m going to reach deep into my memory (what’s left of it) for some wins. Who knows what I’ll find in there?!

I like to call him Uncle Claude, but as far as I know we’re not related. Too bad - Claude Shannon was undisputably a badass (just look at him). And now that I’ve gone and read just half of that Wikipedia article, I can say so even more confidently. He shot the shit Alan Turing, for god’s sake! More importantly for the purposes of this blog post, he was “the father of information theory” and co-(co-co-co-co-)claimant of the Nyquist-Shannon sampling theorem.
My story takes place back in the early-to-mid aughts, when I was still feeling my way around being an electronics engineer working in automated testing. That means: plug a piece of electronics (i.e. “the box”) up to a (woefully antiquated) test station and fire up the program for that particular box. It’ll poke it with five volts here, twenty there, maybe some 240-volt three-phase, and then make sure it reacts the way it’s supposed to. My job was to make changes to the test program as necessary to keep the production shop running. In this particular instance I had already made my changes and verified they worked. There was another test that kept failing, though - not always, but definitely most of the time. It wasn’t one of my requirements, and while failing random tests wasn’t unheard of given the condition of the equipment, I knew something was up.
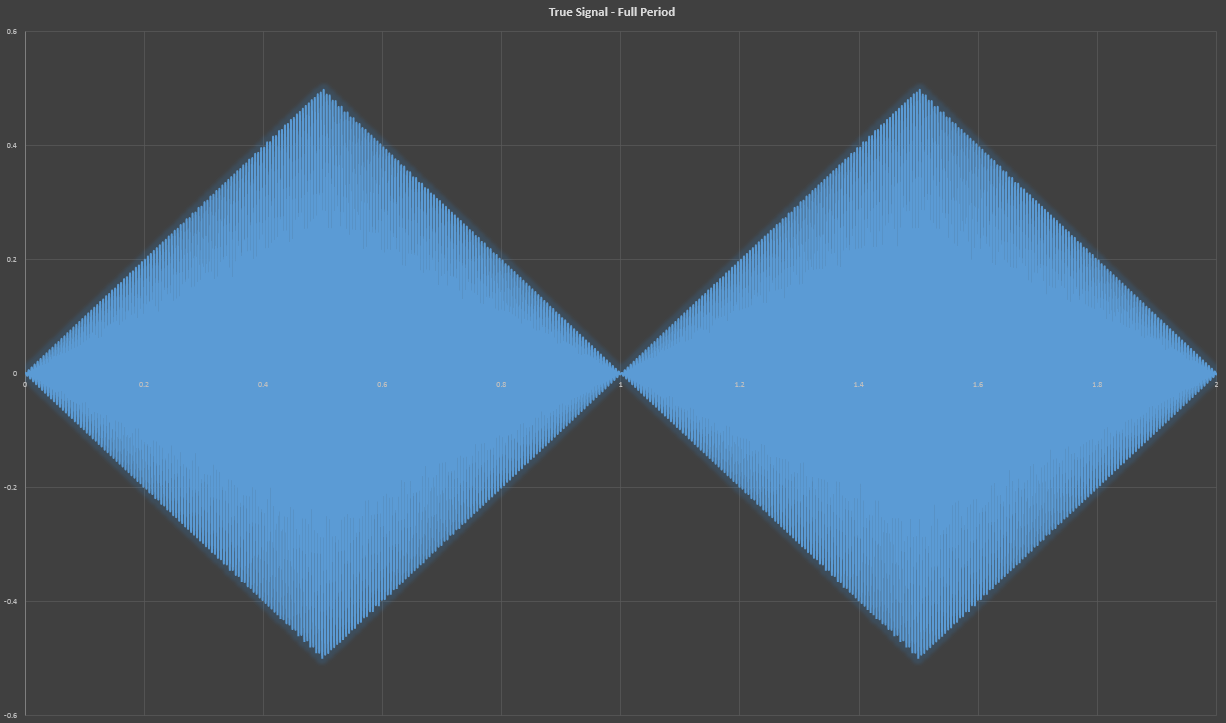
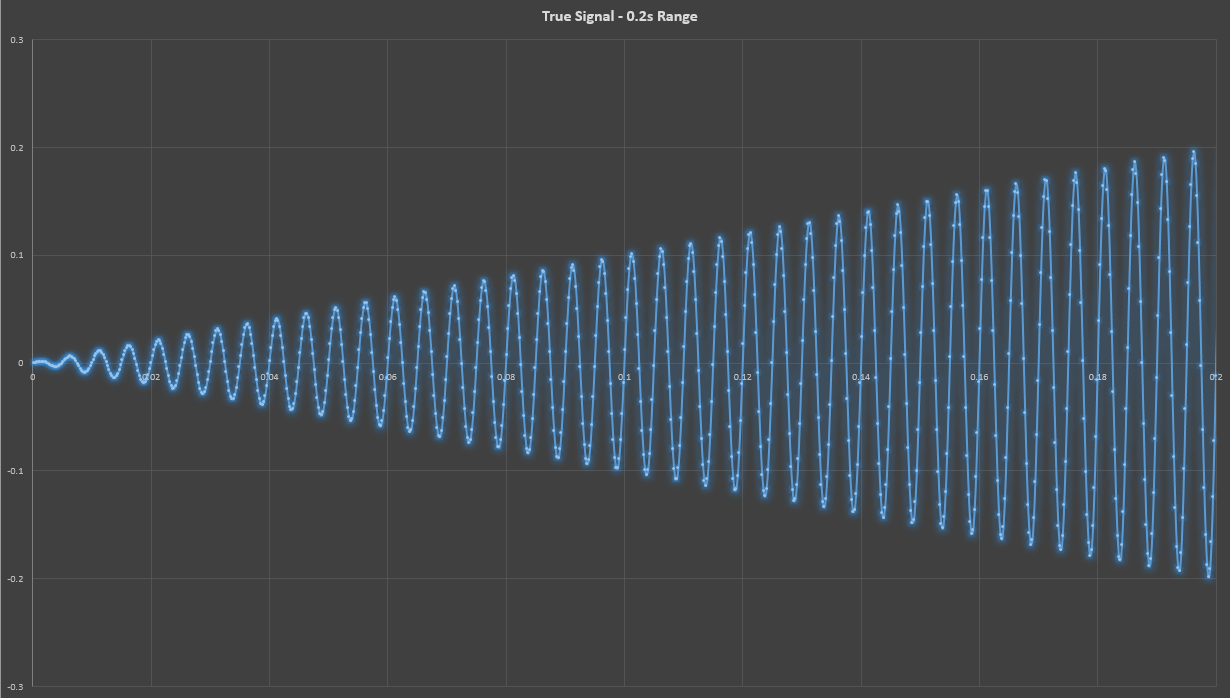
I hooked up my oscilloscope and checked it out, it was a 400-Hz sine wave signal amplitude modulated by a 0.5-Hz triangle wave.
That’s the wide-angle view; let’s zoom in:
The problem was that the station measured the peak voltage just a little lower than expected. But it looked fine to me on the scope! What was going on here? I banged my head against it for a few days. I looked up the history of problems with this test. This wasn’t the first time anyone had encountered it - twice before engineers investigated it, only to have the problem magically fix itself (i.e. they gave up).
Then I had a breakthrough. Call it tenacity if you want, but I freely admit it was luck. I had the signal on my scope, with the peak voltage displayed correctly. Then I just happened to dial the “SEC/DIV” knob (which changes the time scale and squishes/expands the signal horizontally) to a point where several periods of the signal were in view (you might say I zoomed waay out)… and the peak voltage dipped! I immediately knew what I was dealing with: aliasing.
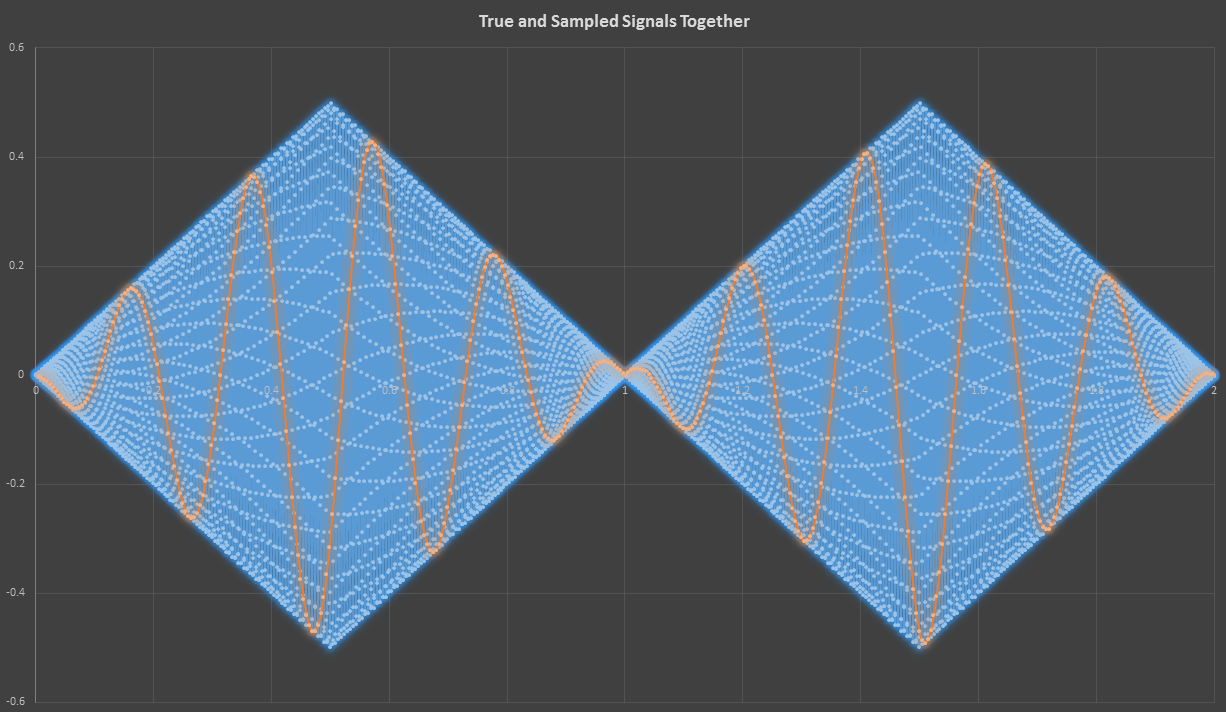
Digging into the station documentation, I found the tidbit of info that confirmed my suspicions: all measurements were based upon 1024 samples. Always. It would try to infer an appropriate sample width (or timeframe) to capture a representative signal from which to calculate measurements, but you could also specify the sample width manually. In the case of this test, the sample width was set to five seconds. This equates to a sampling rate of 204.8 Hz (1024 samples / 5.0 seconds). That’s not going to faithfully capture the 400-Hz sine wave; not according to Uncle Claude! He always told me growing up (c’mon, let me fantasize), “Jeremy, boy. You’ve always got to sample at at least twice the rate of the highest frequency of the signal you’re trying to capture.” See how the signal constructed based on that sampling rate is aliased to hell and back?
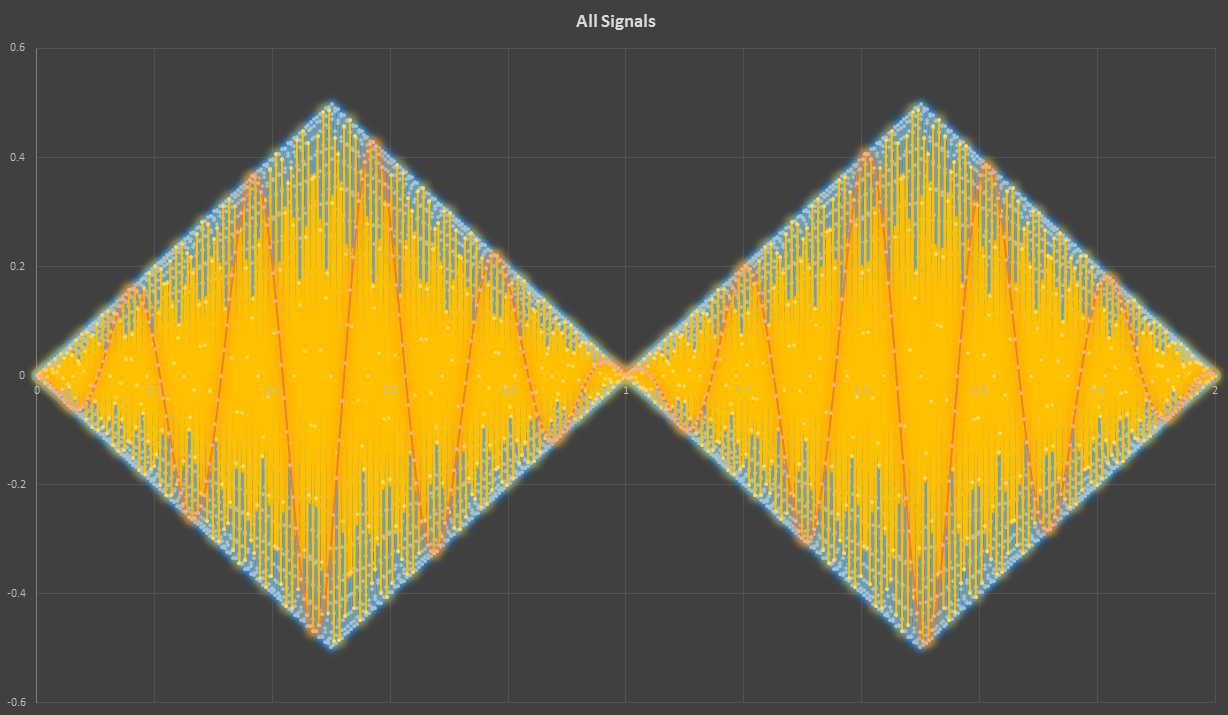
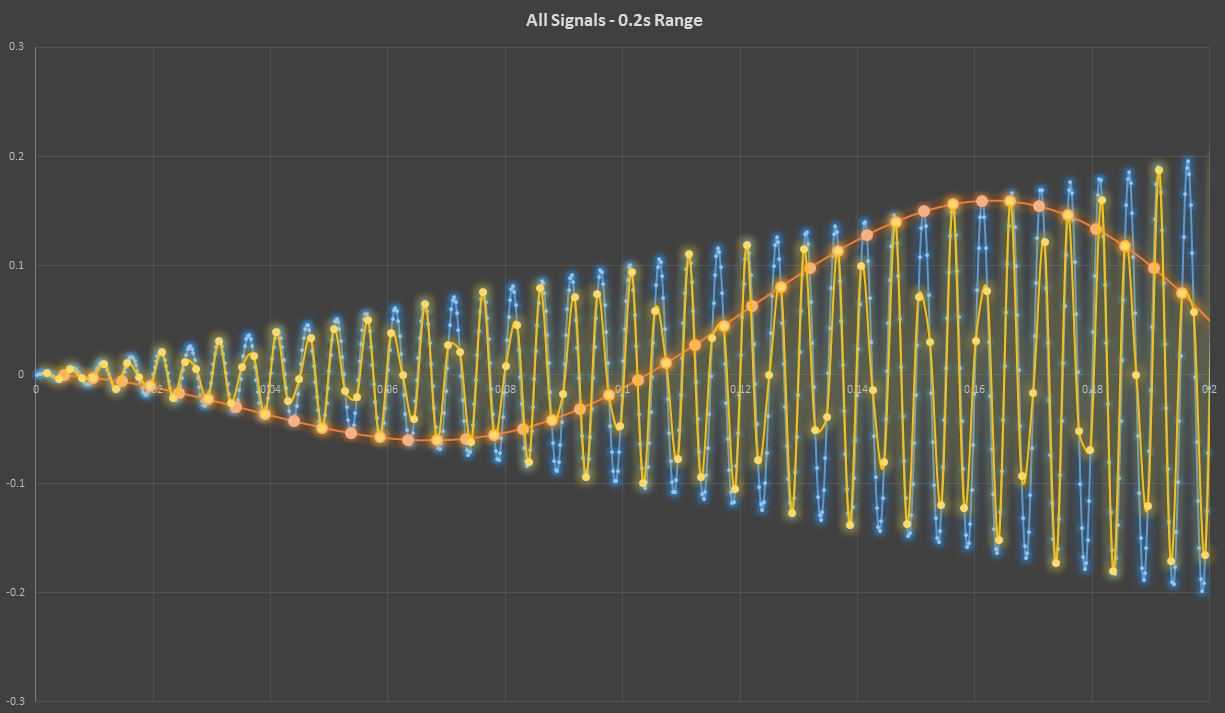
The blue is the original signal, and the orange is the aliased, reconstructed signal.
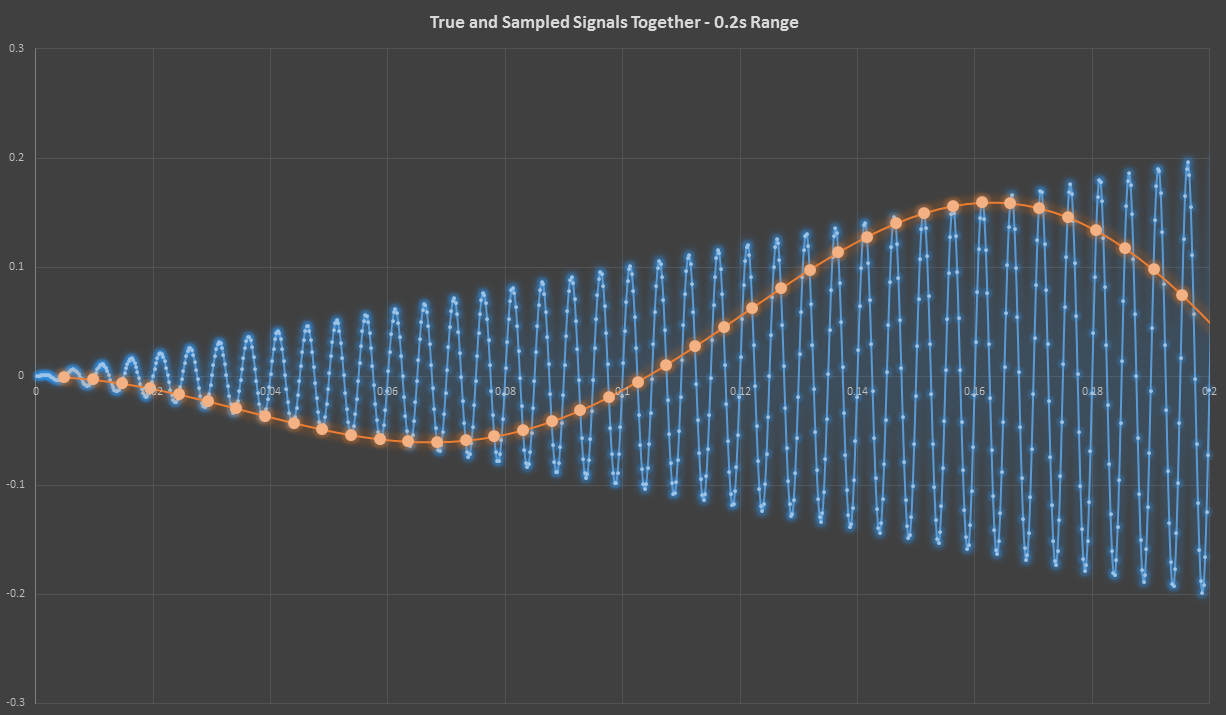
Zooming in, you can see that the sampling points on the aliased signal come from valid points on the true signal.
Yuck! That reconstructed signal is not like the original. The reson I wasn’t seeing this effect on the scope until I zoomed far out is because it sampled at a much higer rate than the test station. Incidentally, this is the exact phenomenon that makes wheels or helicopter rotors seem to spin slowly, or backwards, or not at all in video.
I changed the sample width to two seconds (a sampling rate of 512 Hz). See how much more faithfully it captures the signal (in yellow, this time)?
It still wasn’t faithfully reconstructing the true signal, but I wanted to be sure to capture a full period of the 0.5-Hz triangle wave, and the peak voltage of the resulting reconstructed signal was good enough to pass the test. Yippie!
